 twitto.be
- Real time dashboard of Belgian startup tweets
twitto.be
- Real time dashboard of Belgian startup tweets
Twitto.be is closed
April 11th, 2023
Hi, following some changes on how twitter provides access to its data, I have decided to close down this website, and archive twitto's source code.
Twitto has been online since 2013, and caught the interest and engagement of Belgian twitter users. An average of 5000 people visited the website each year, and the tweets sent by @twitto_be reached 350k people every year. If you'd like to know more about what twitto was, read the story of twitto.be.
If you need help designing and building interactive reports and dashboards, get in touch on my new site alef.website.
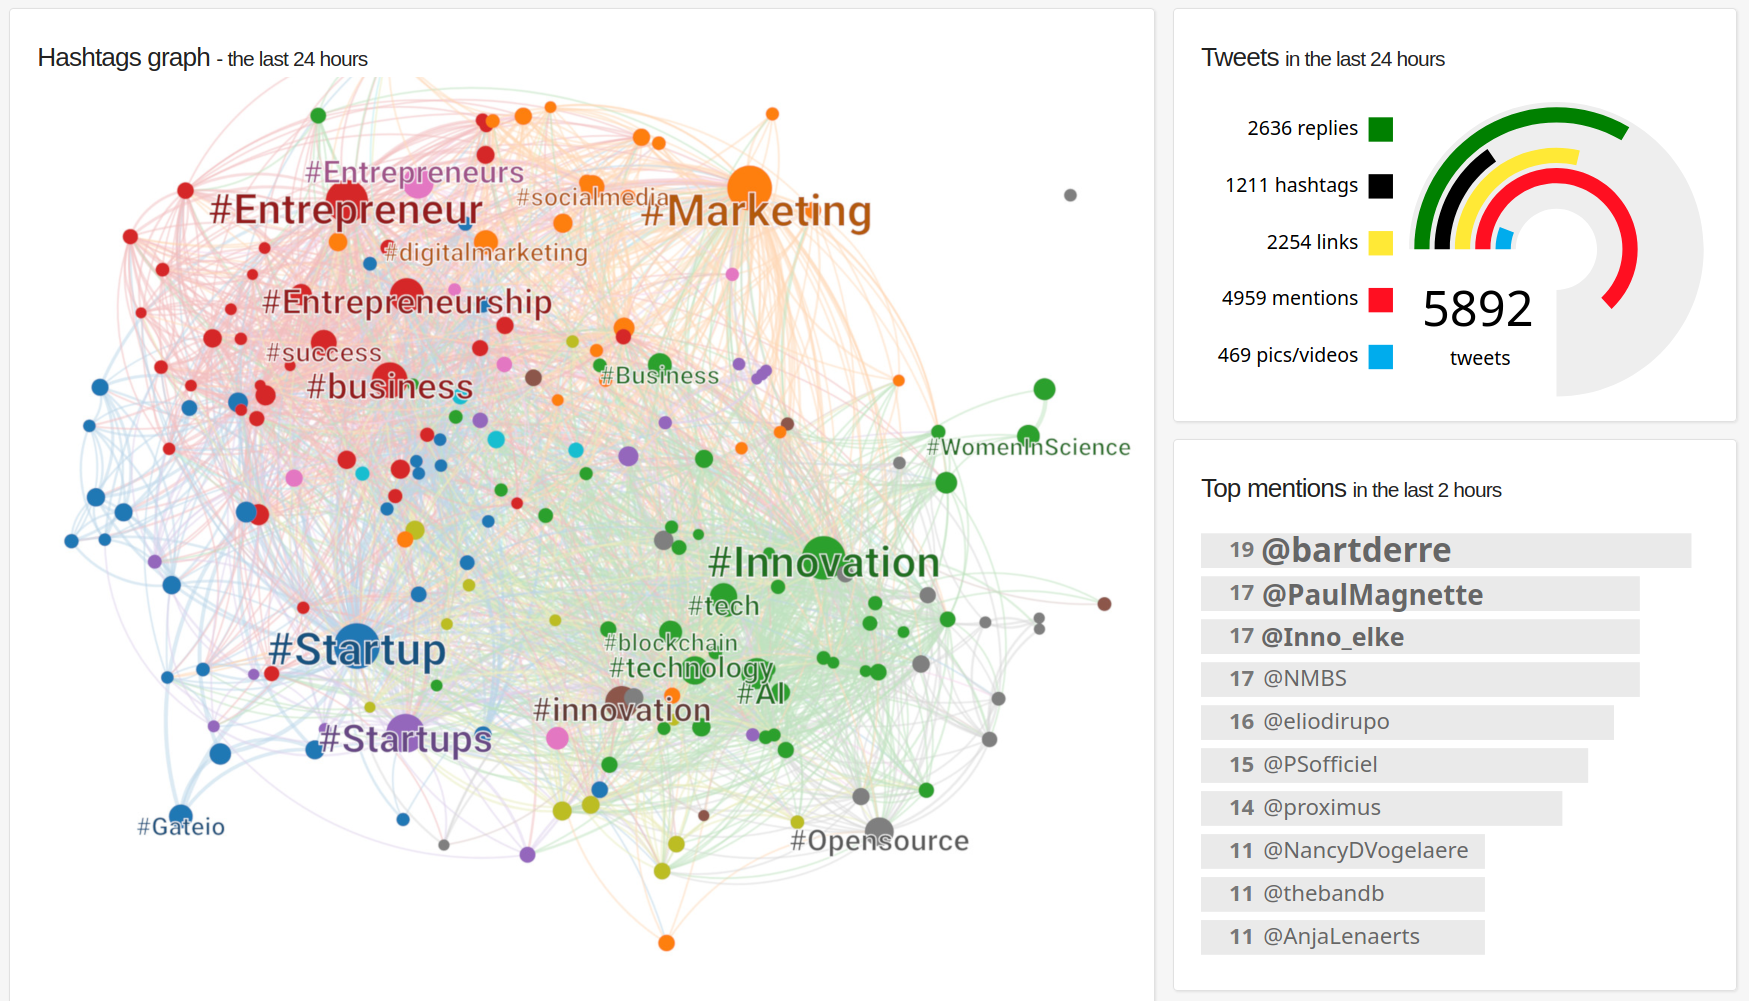
Twitto used to look like this at some point.